Article 3:
Remember the early internet – Web 1.0 – so named long after its demise? It featured static websites with no interactive content. We reached them by hijacking our hard-wired household phone lines with sluggish modems that beeped us slowly to AltaVista or Ask Jeeves.
Then came faster internet speeds, which opened our eyes to dynamic websites, streaming content and social media, precursor to the interactive Web 2.0. Now, internet gurus are talking about Web 3.0, and they’re still trying to define it: more privacy, more virtual reality, more cyber security … more to come.
But, guess what? Demand response also now has evolved from version 1.0 to 3.0, and experts have a darn good idea of what DR 3.0 will look like.
According to the Peak Load Management Alliance (PLMA), DR 1.0 was utility-controlled load shedding that happened when the power provider called or paged a commercial or industrial power consumer to curtail usage. On the residential side, DR 1.0 meant using a one-way load control device to shut down household air conditioners, water heaters, pool pumps and the like. Next came DR 2.0, which the Smart Electric Power Alliance (SEPA) says includes bilateral communications, more locational control and some automated DR capabilities.
Now, says PLMA, “demand response is evolving to be a component of broader distributed energy resources (DER),” such as distributed generation and energy storage. As one of the many DER impacting operations, demand response can support renewables integration, supply capacity, address congestion issues and more.
That’s DR 3.0, and here’s a look at what changes it is bringing the electric utility sector:
Non-wires Solutions to Capacity Constraints
 Right now, 10 percent of utilities surveyed by SEPA use some form of demand management to defer grid upgrades. Another 60 percent of respondents are either planning or considering such action.
That approach is called a non-wires solution (NWS) or non-wires alternative (NWA). Such initiatives are comprised of investments or programs that leverage locational deployment of things like distributed generation and storage, energy efficiency or demand response – plus control software – to reduce load at a substation or circuit level and thereby defer or eliminate the need for equipment upgrades, such as transformers and power lines.
In an article that appeared in a recent issue of AESP magazine, analysts from Navigant wrote, “We see ample evidence throughout North America that NWS interest and experience is expanding. We expect NWS to play an important role in the future of distributed energy resources.”
Among the utilities you’ll find using NWS already are these two:
Consolidated Edison saved big bucks with its Brooklyn Queens Demand Management Program. This effort helped the utility defer construction of a $1.2 billion substation and meet the load with 52 megawatts of demand management and 17 megawatts of distributed, customer-sited resources.
Central Hudson Gas & Electric has four NWA projects currently underway. One, the Peak Perks program, earned an award from the Peak Load Management Alliance. The program aimed to defer infrastructure investments in three network zones. It’s 5.9-megawatt, first-year load reduction success beat the target of 5.3 megawatts. The utility signed up more than 30 percent of eligible customers within six months.
All told, GTM Research found 133 NWA projects underway as of mid-2016 and estimated they would add as much as 1,960 megawatts of capacity. Navigant Research expects global NWA spending to grow from $63 million in 2017 to $580 million in 2026.
DR with EVs will accelerate
Early this year, Matt Stanberry, Vice President of Market Development at Advanced Energy Economy, told Utility Dive he expected 2018 to be the year of the electric vehicle. Why? Because sales have skyrocketed at a compound rate that hit or topped 50 percent each year since 2011, and analysts expect growth to accelerate beyond those impressive numbers.
Worldwide, the International Energy Agency forecasts EV growth will rev up from 3 million now to 125 million by 2030. Global growth in 2017 was 54 percent.
Not surprisingly, SEPA found that 79 percent of utility respondents surveyed in 2018 were either planning, researching or considering a managed EV charging program. Managed charging can happen via a direct load-control approach where the utility uses devices and communications signals to control the charging event, or the program can be voluntary.
The Sacramento Municipal Utility District, Austin Energy and Salt River Project are among utilities prompting consumers to charge during off-peak hours with demand-management-focused rates.
Pepco piloted direct management of charging in a program that used secondary meters for household charging stations, and these meters were equipped with communications for demand response. The utility didn’t turn chargers off. It simply turned them down for an hour, ratcheting power from Level 2 charging, which supplies 240 volts and charges a typical battery overnight, to Level 1 charging, a 120-volt approach that would take about 18 hours or more to recharge a fully discharged vehicle battery. While pre-event notifications seemed to inspire customers to voluntarily shift their charging hours, the utility also found that communications glitches made its piloted solution unfeasible.
More Consumer-assisted DR
Research from the Smart Energy Consumer Collaborative (SECC) showed that 59 percent of consumers were either “probably interested” or “definitely interested” in demand management programs that reward consumers for curtailing or shifting their electricity usage during high-demand periods.
It’s certainly getting easier for consumers to participate in such programs — and easier for utilities to offer them — now that consumers can buy smart thermostats at Home Depot and other outlets.
For utilities, smart thermostats offer considerable savings on program deployment costs. According to SEPA, when the utility or program partner installs a smart thermostat, costs run between $225 and $300. When consumers do-it-themselves, the costs hover around $150 to $250, with up to $200 being picked up by the consumers.
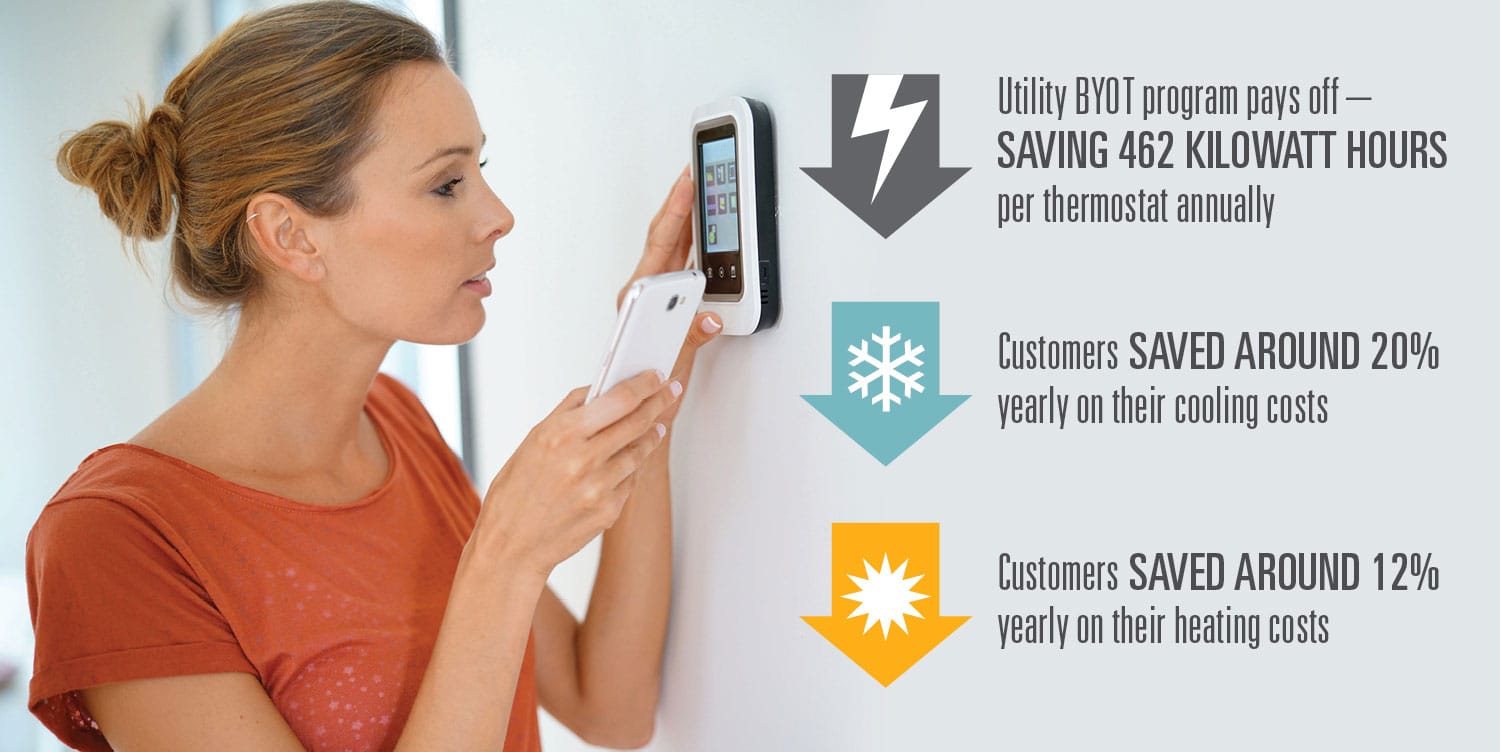
Kansas City Power & Light offers a great example of how engaging consumers in a BYOT program can pay off. The utility launched a DR program featuring incentives for consumers who’d allow the utility to control temperatures settings on occasion via a Nest thermostat in early 2016. Consumers with air conditioning and home Wi-Fi had three options for participating in the program: Have a pro install the unit, install it yourself and get $50 along with your Nest thermostat, or bring your own thermostat and get $100. Each option earns participants a $25 annual incentive.
Two years after the program launch, the utility had achieved 150 percent of the program goal, and some 80 percent of the program participants chose do-it-yourself installation. The utility saved an average of 462 kilowatt hours per thermostat annually, while customers saved around 20 percent on their cooling costs and another 12 percent on heating costs each year.
As of 2016, Navigant analysts estimated there were only 50,000 utility customers participating in bring-your-own-thermostat programs but, by September 2017, that number had grown to more than two million installations. Navigant’s researchers expect the number to reach six million by 2024.
